High-volume automotive machining runs on narrow margins, repeatable cycles, and thousands of cutting engagements each shift. OICA reported approximately 93.5 million motor vehicles were produced worldwide in 2023. That scale makes small tooling losses significant. A two-second cycle increase can consume many production hours across several machining cells. Premature insert failure can also create burrs, dimensional drift, scrap, and unplanned stoppages. The consequences are practical, not theoretical.
The International Energy Agency reported that global electric car sales exceeded 14 million units in 2023. Electric vehicles use different components, materials, and machining strategies. Aluminum housings, hard steels, and battery-related parts can place new demands on cutting edges. Deloitte’s 2024 Smart Manufacturing and Operations Survey found that manufacturers increasingly view digital production as a competitiveness driver. However, digital dashboards alone cannot extend tool life. Operators still need reliable cutting data, stable workholding, correct coolant delivery, and disciplined inspection.
This is where how to optimize tool life in high volume automotive machining becomes a production question. The answer involves more than selecting a harder grade. Engineers must connect tool wear patterns with spindle load, vibration, surface finish, cycle time, and actual part quality. A worn edge may still produce acceptable dimensions, but it can raise burr formation or fracture risk. Tool-life targets should therefore reflect the whole process.
The data has limits. Published industry reports rarely isolate tool-life savings across identical automotive lines. Plant trials remain essential. A controlled test with documented tool geometry, material batch, coolant pressure, and replacement criteria gives stronger evidence than a supplier claim. Small details matter. A few microns can change the decision.
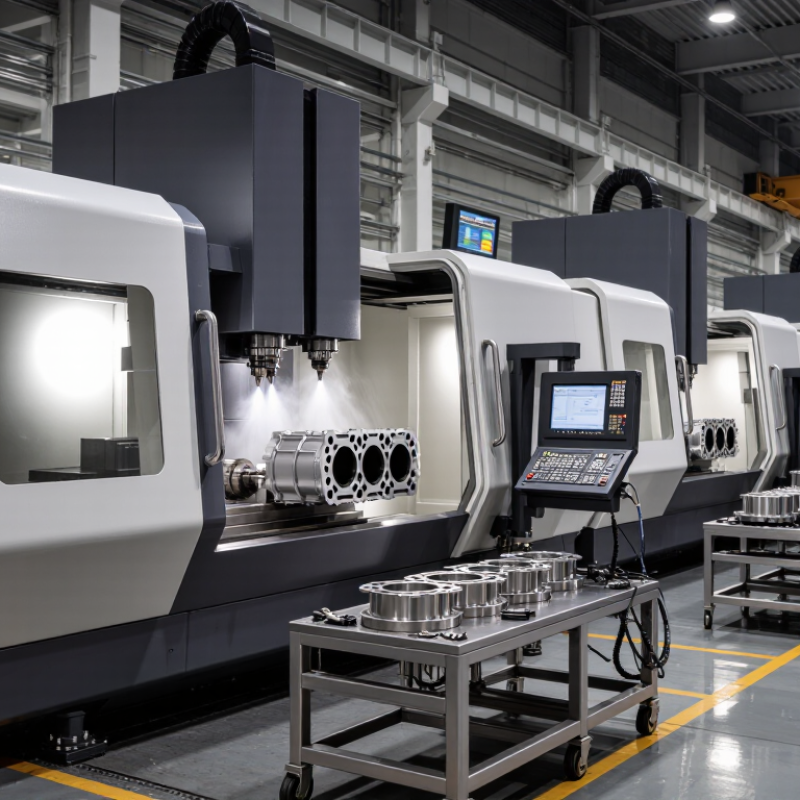
In high-volume automotive machining, tool life means the usable cutting time before a defined failure limit is reached. It is not simply the moment an insert breaks. ISO 3685 evaluates tool life through measures such as flank wear, crater wear, surface finish, and dimensional accuracy. In production, engineers often translate this interval into parts per cutting edge or minutes per operation.
That distinction matters. A tool may still cut, yet produce oversized bores, rough sealing surfaces, or unacceptable burrs. The edge is tired. Practical monitoring combines wear measurements with spindle load, vibration, cutting temperature, and cycle-time changes. A 2024 Smart Manufacturing and Operations Survey reported that 86% of manufacturing leaders viewed smart manufacturing as important for future competitiveness. That expectation supports data-based tool-life control, especially across hundreds of identical cycles.
The economic pressure is substantial. The International Energy Agency reports that industry consumed about 37% of global final energy in 2022. Excessive wear can increase cutting forces, energy use, scrap, and unplanned stoppages. A replacement interval should therefore maximize predictable production, not extract the final possible cut from an edge. The definition remains imperfect because tool life changes with alloy variation, coolant condition, chip evacuation, and machine stiffness. Real production data can expose those gaps. Sometimes, the “best” tool life is shorter than laboratory testing suggests.
Reference data table for evaluating cutting-tool durability, productivity, quality, and operating cost in high-volume automotive production.
| Data Dimension | Definition or Measurement | Typical High-Volume Reference Range | Why It Matters |
|---|---|---|---|
| Tool life | The usable cutting time, cutting distance, or number of parts produced before a defined end-of-life criterion is reached. | Usually tracked in minutes, meters of cutting distance, or parts per edge. | Creates a consistent basis for production planning, tool-change scheduling, and cost analysis. |
| Common tool-life criterion | A measurable limit such as flank wear, crater wear, edge chipping, dimensional drift, burr formation, or unacceptable surface finish. | For carbide tools, a flank-wear limit of approximately 0.2–0.3 mm is commonly used, depending on the operation and quality requirement. | Prevents premature tool replacement while protecting part quality and process stability. |
| Parts produced per cutting edge | Number of acceptable components completed by one usable cutting edge before a planned tool change. | Often ranges from tens to several hundred parts, depending on material, tool geometry, cutting parameters, and operation type. | Directly affects tool consumption, machine interruptions, and production throughput. |
| Cutting speed | Relative surface speed between the cutting edge and the workpiece, normally expressed in meters per minute for turning and milling. | Common carbide applications cover approximately 100–600 m/min, with the actual value determined by workpiece material and tool grade. | Higher speed can raise output but may accelerate wear, heat generation, and edge failure. |
| Feed rate | Distance advanced per revolution or per tooth, commonly expressed as mm/rev or mm/tooth. | Typical carbide milling values are often approximately 0.05–0.30 mm/tooth; turning commonly uses about 0.10–0.50 mm/rev, depending on the operation. | Influences material removal rate, cutting force, surface finish, and the rate of edge degradation. |
| Material removal rate | Volume of workpiece material removed per unit of time, generally expressed in cm³/min or mm³/min. | Varies widely from less than 1 cm³/min in finishing to more than 50 cm³/min in aggressive roughing operations. | Shows whether a tool-life improvement also maintains the required production rate. |
| Tool-change frequency | Number of planned and unplanned tool changes during a shift, batch, or production day. | A stable process may use scheduled changes every several dozen minutes to several hours, depending on tool life and cycle time. | Frequent changes increase non-cutting time, setup variation, and the risk of incorrect tool installation. |
| Tool-change downtime | Time required to stop the machine, replace or index the tool, verify offsets, and return to production. | Approximately 1–10 minutes per change, depending on machine design, automation, accessibility, and verification procedures. | Even short interruptions become significant when multiplied across multiple machines and shifts. |
| Dimensional capability | Ability of the machining process to hold specified dimensions consistently over the tool-life interval. | Many automotive features require tolerances from approximately ±0.01 mm to ±0.10 mm, depending on the component and feature. | A tool that lasts longer but causes dimensional drift can increase scrap, rework, and inspection requirements. |
| Surface roughness | Average surface-texture value used to evaluate the machined surface, commonly reported as Ra in micrometers. | Typical machined automotive features may specify approximately Ra 0.8–6.3 µm, depending on function and finishing operation. | Progressive wear can increase roughness and compromise sealing, fitting, fatigue, or appearance requirements. |
| Unplanned tool failure | Unexpected breakage, chipping, pullout, or severe wear that interrupts production before the planned change point. | Target performance is near-zero catastrophic failures; the practical objective is to detect wear before it becomes a quality or safety event. | Unplanned failures can damage fixtures, affect multiple parts, and create longer recovery time than scheduled changes. |
| Tool cost per part | Tooling expenditure divided by the number of conforming parts produced during the tool’s usable life. | Calculated from tool price, number of usable edges, regrinding or indexing options, and parts produced per edge. | A longer life can reduce direct tooling cost, but only when quality and cycle-time targets are preserved. |
| Overall cost per part | Combined effect of tooling, machine time, labor, energy, maintenance, scrap, rework, and downtime per conforming part. | Should be evaluated using a total-cost model rather than tool purchase price alone. | Tool-life optimization is valuable when it lowers total manufacturing cost while maintaining throughput and quality. |
| Process monitoring indicators | Signals such as spindle power, cutting force, vibration, acoustic emission, temperature, dimensional trend, and visual wear. | Monitoring limits are normally established from baseline process data and validated through controlled trials. | Enables condition-based tool changes instead of replacing tools too early or after failure. |
| Optimization objective | Maximize productive cutting time and tool utilization while meeting safety, dimensional, surface-finish, and delivery requirements. | The best operating point is a validated balance among cutting speed, feed, depth of cut, coolant strategy, tool geometry, and change interval. | Longer tool life alone is not sufficient; the target is stable, repeatable, and economically efficient production. |
Tool life is the usable cutting time before a defined failure limit. It may be measured in minutes or parts per cutting edge.
No. A tool can still cut while producing oversized bores, rough sealing surfaces, or unacceptable burrs. The edge is tired.
Watch flank wear, crater wear, spindle load, vibration, cutting temperature, and changing cycle times. Small changes matter.
Wear increases cutting forces and heat. Parts may lose dimensional accuracy, surface quality, or stable edge conditions.
Tools experience different alloy variation, coolant conditions, chip evacuation, and machine stiffness. Some tools fail early. Others remain usable.
Combine tool usage, part measurements, torque readings, vibration trends, and visual inspections. Keep clear and honest process records.
Not always. One extra replacement may seem expensive, but a rejected batch can cost much more. Predictable production matters more.
Set inspection points before problems appear. Track spindle behavior and critical dimensions across repeated cycles.
We focused too heavily on tool cost and underestimated setup disruption. Our first assumption was imperfect.
Yes. Real production includes machine variation, coolant changes, and inconsistent material behavior. Sometimes, shorter is safer.
Tool life in high-volume automotive machining refers to the usable cutting time a tool can provide while maintaining dimensional accuracy, surface quality, and stable process performance. It is influenced by cutting speed, feed rate, depth of cut, workpiece material, tool geometry, coolant conditions, machine rigidity, and chip evacuation. As tools wear, manufacturers may experience dimensional variation, poor surface finishes, increased cycle interruptions, higher scrap rates, and unexpected equipment downtime.
Learning how to optimize tool life in high volume automotive machining requires a balanced approach to process control and tool management. Manufacturers can monitor wear through inspections, machining data, power consumption, vibration, and part-quality measurements. Adjusting cutting parameters, improving coolant delivery, selecting suitable tool materials and coatings, maintaining machine alignment, and replacing tools according to condition rather than fixed schedules can extend service life. Effective optimization improves productivity, reduces tooling and maintenance costs, supports consistent quality, and strengthens overall production reliability.

 Tier Tool